


- TOP
- Search using keywords
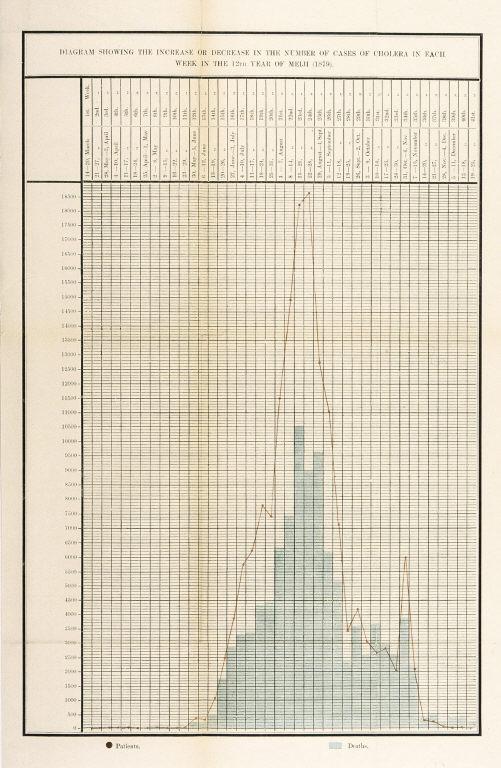
- 明治12年<1879年>週毎のコレラ患者数の増減を示す図/(Diagram showing the increase or decrease in the number of cases of cholera in each week in the 12th year of Meiji (1879).)
明治12年<1879年>週毎のコレラ患者数の増減を示す図/(Diagram showing the increase or decrease in the number of cases of cholera in each week in the 12th year of Meiji (1879).)


Related Image
Showing 3 of 1-3 Results (total 1page)
| caption | : | 明治12年<1879年>週毎のコレラ患者数の増減を示す図/(Diagram showing the increase or decrease in the number of cases of cholera in each week in the 12th year of Meiji (1879).) |
| note | : | |
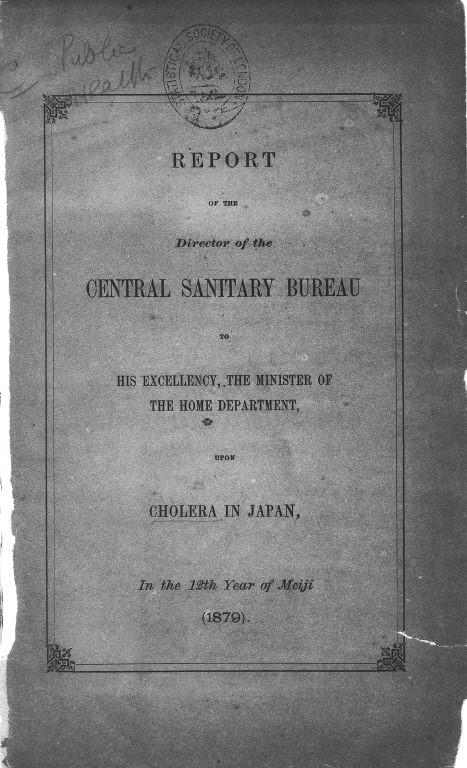
| book title | : | 明治12年1879年の日本におけるコレラに関する内務省衛生局長報告書 |
| author | : | ナガヨ センサイ ( 長与 専斎 )/(Nagayo, Sensai) |
| year | : | [1879?] |
| Library Number | : | RC/134/Na |
| author | : | 000050872 |
| GID | : | GO003002 |
| PhotoCD no. | : | 365 |


International Research Center for Japanese Studies 3-2 Oeyama-cho, Goryo, Nishikyo-ku, Kyoto 610-1192 Japan
Copyright (c)2002- International Research Center for Japanese Studies, Kyoto, Japan. All rights reserved.